Data Visualization and Reporting
With IndicataGo, you can eliminate the hassle of manual data collection, spreadsheet consolidation, and periodic visual updates. Our native reporting engine empowers you to effortlessly create ad-hoc or predefined reports, providing real-time updates and insights into your organization’s overall performance and specific program and project details. Embrace efficiency and stay informed at every step with IndicataGo’s dynamic reporting capabilities.
By dragging and dropping IndicataGo’s data visualization widgets, such as tables, pie charts, and speedometer chart visuals, you can elevate your data analysis and presentation to the next level. Easily transform complex data into intuitive visuals and consolidate them in dynamic dashboards. Leveraging robust analytical capabilities, you can drill down and slice data according to various disaggregations and generate diverse reports.
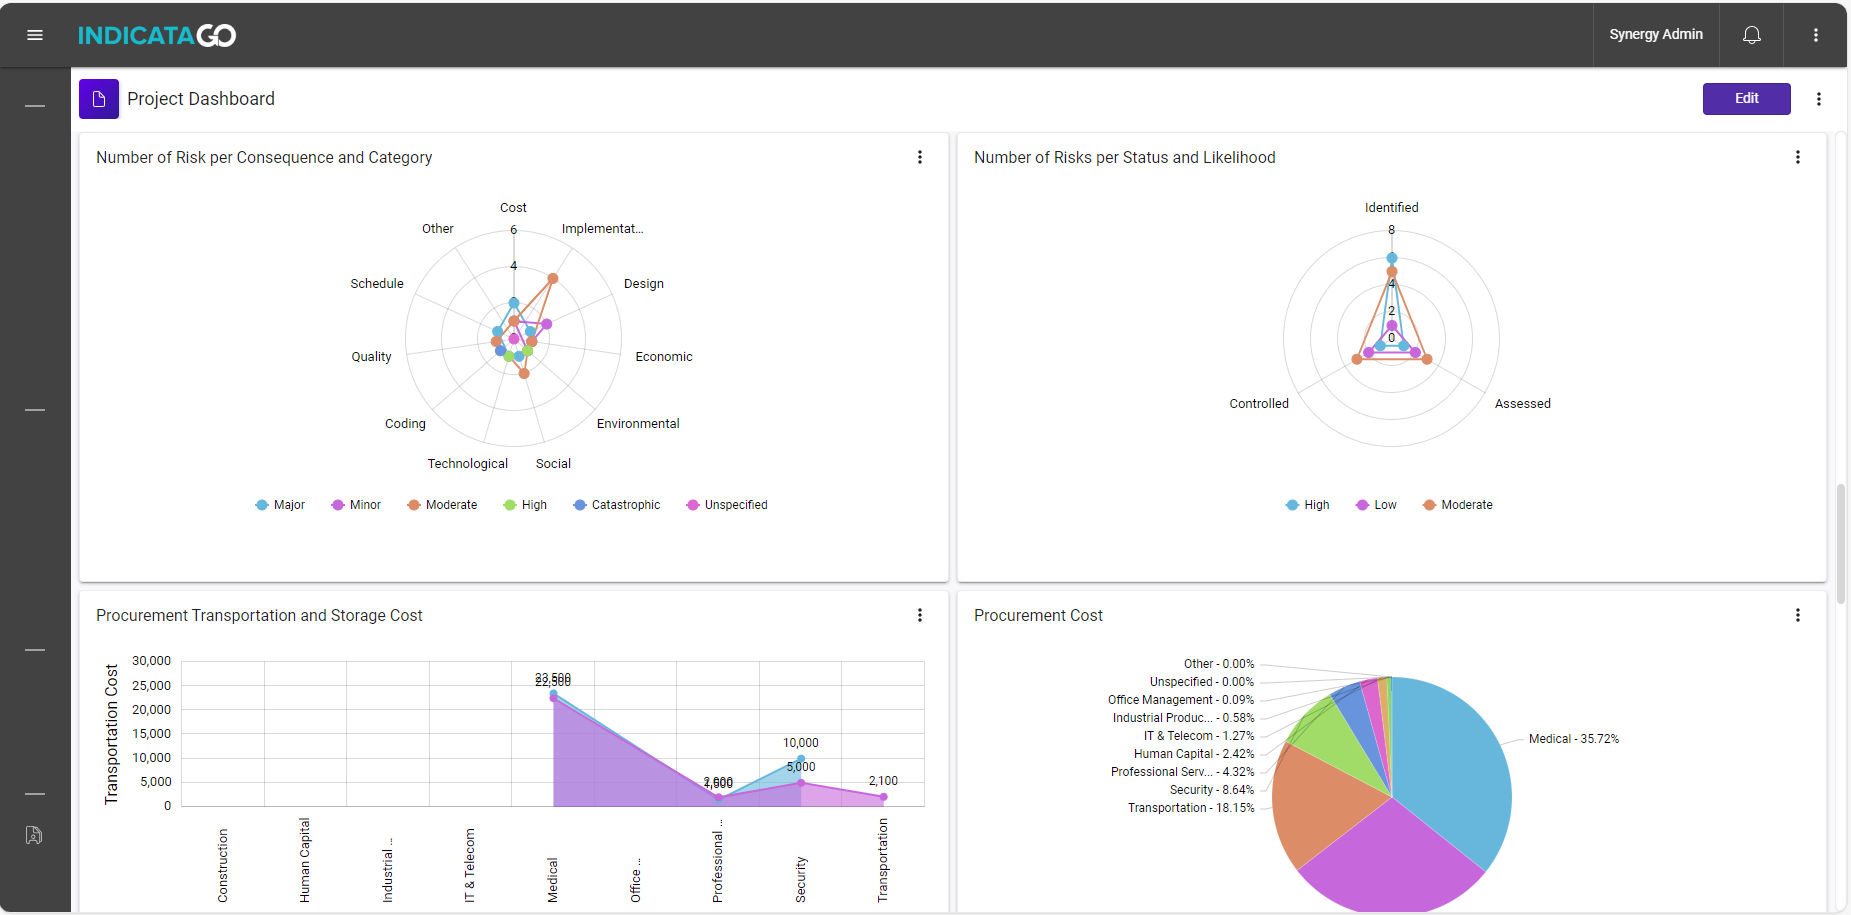
Unlimited Reports
Indicata Report Builder gives you the flexibility to create and generate an unlimited number of custom reports.
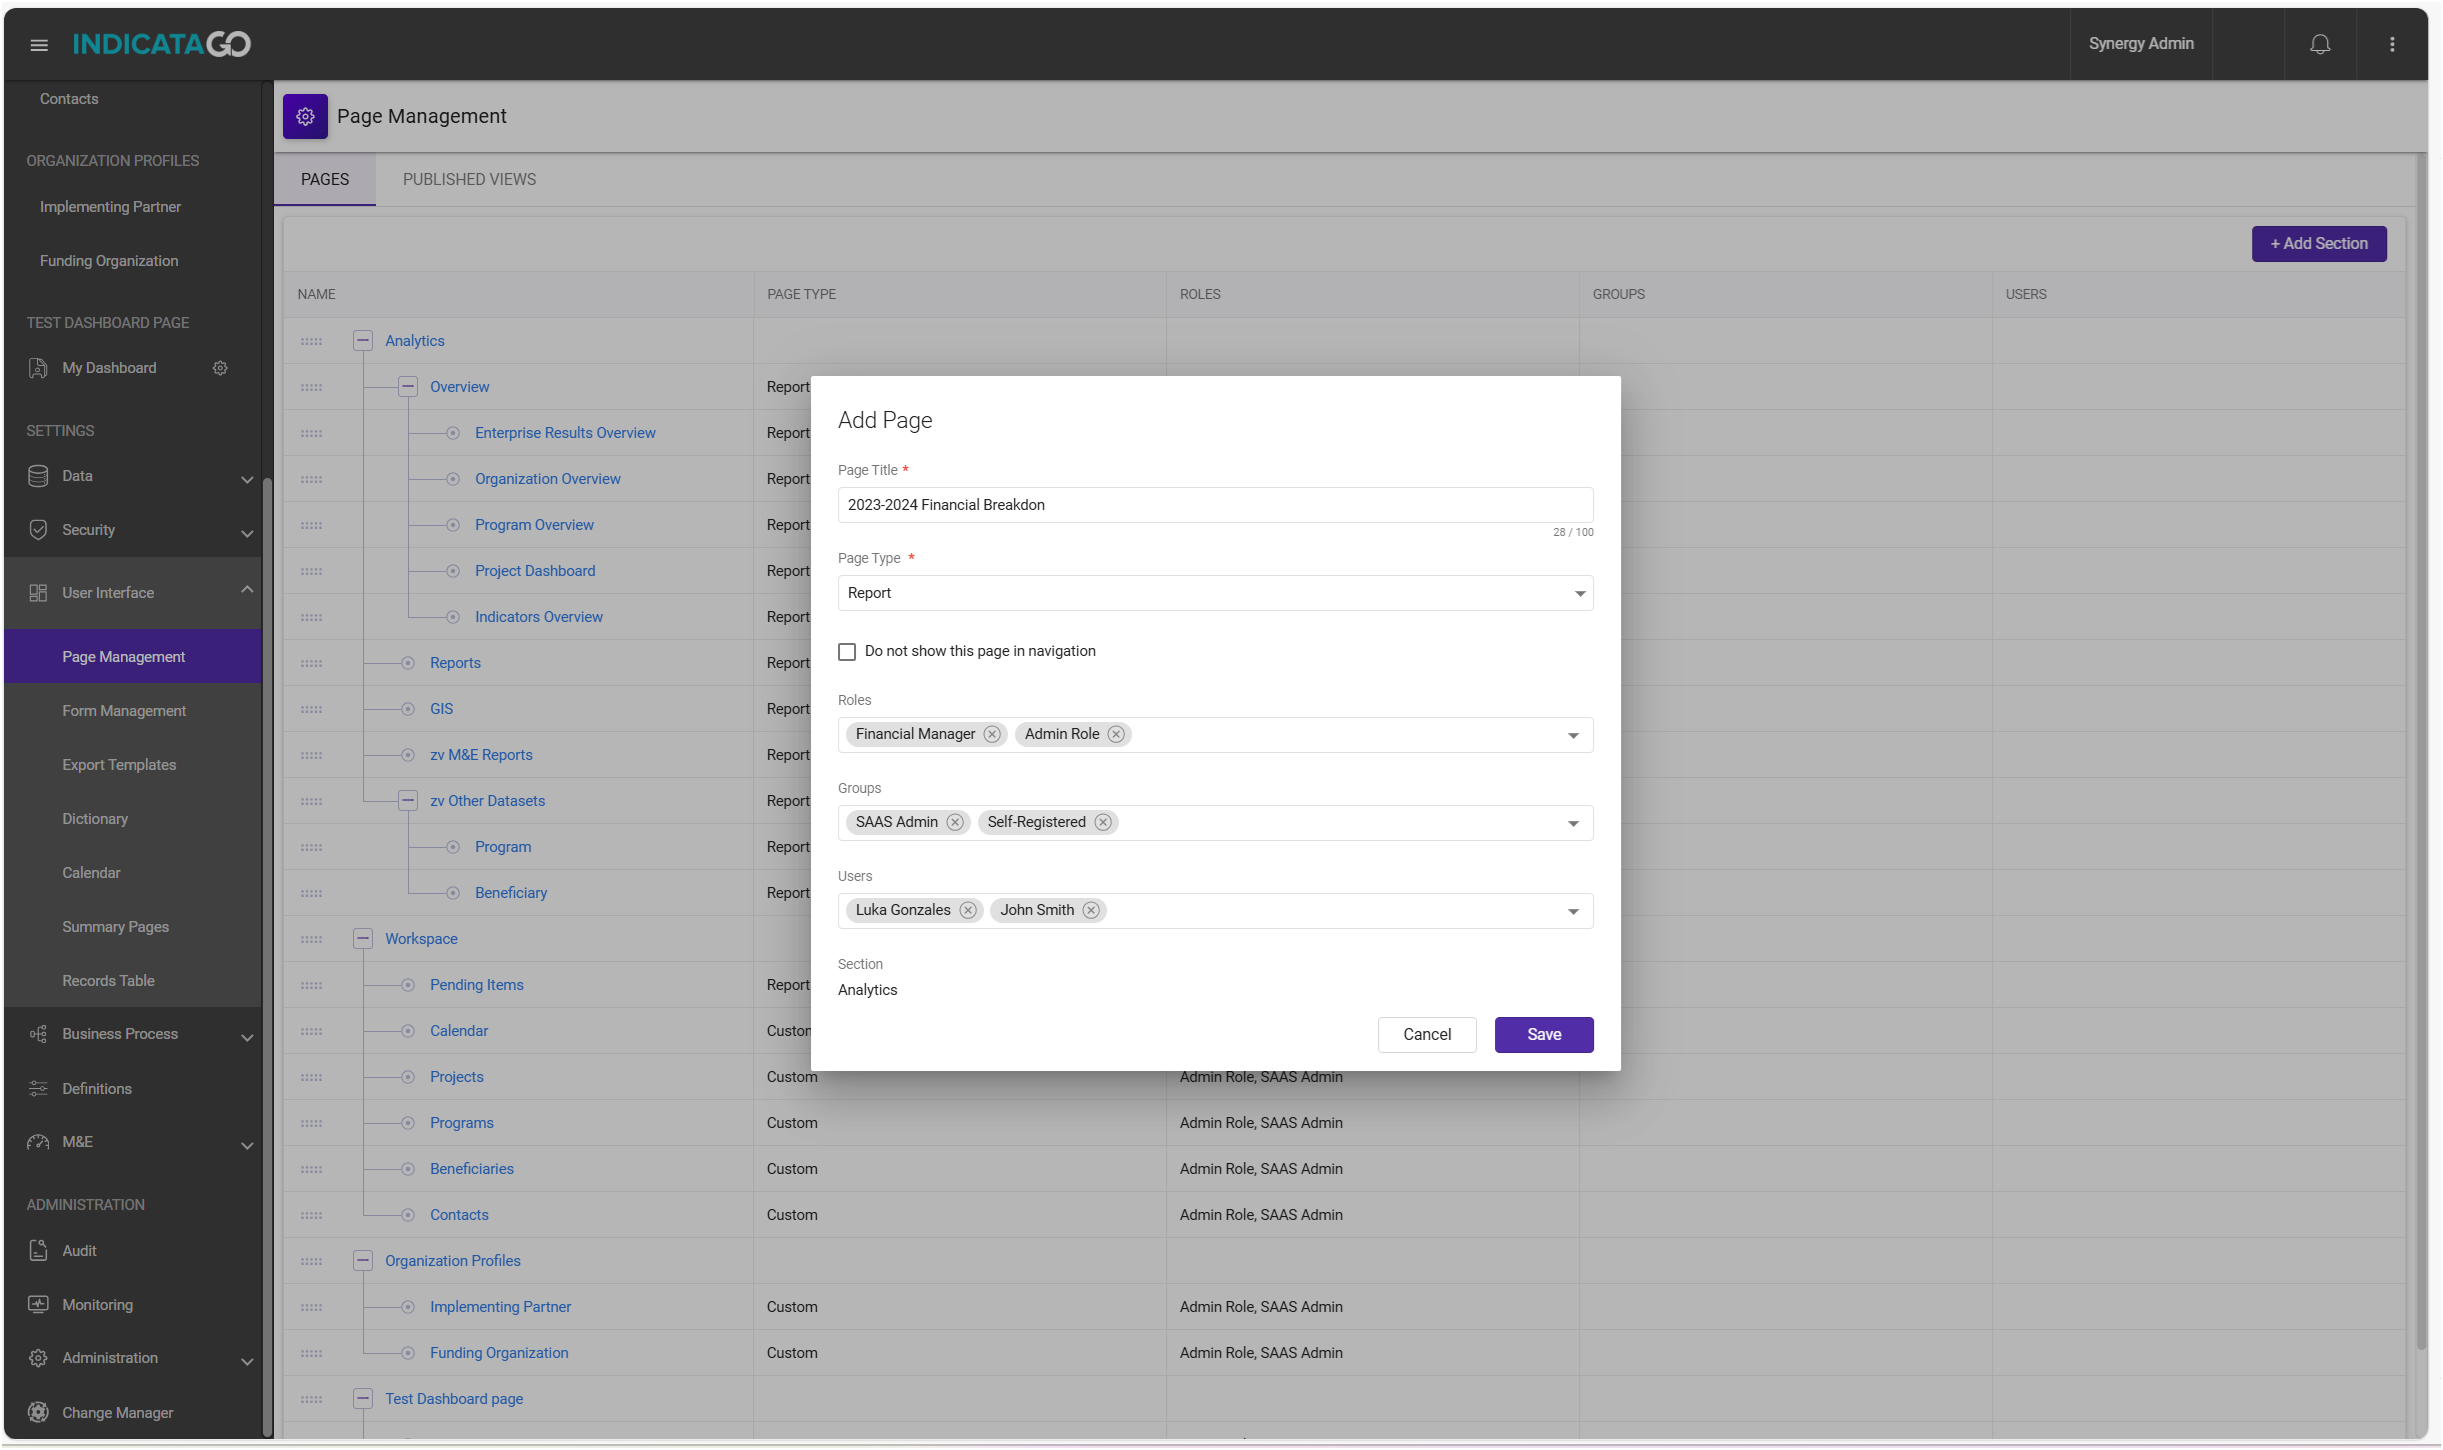
Private and Public Dashboards
The feature may be used to combine different types of analytical views (charts, reports, maps) to provide a meaningful snapshot of the performance of your projects and programs. This also includes creating personalized private views for individual use and sharing public dashboards for collaborative data visualization and reporting.
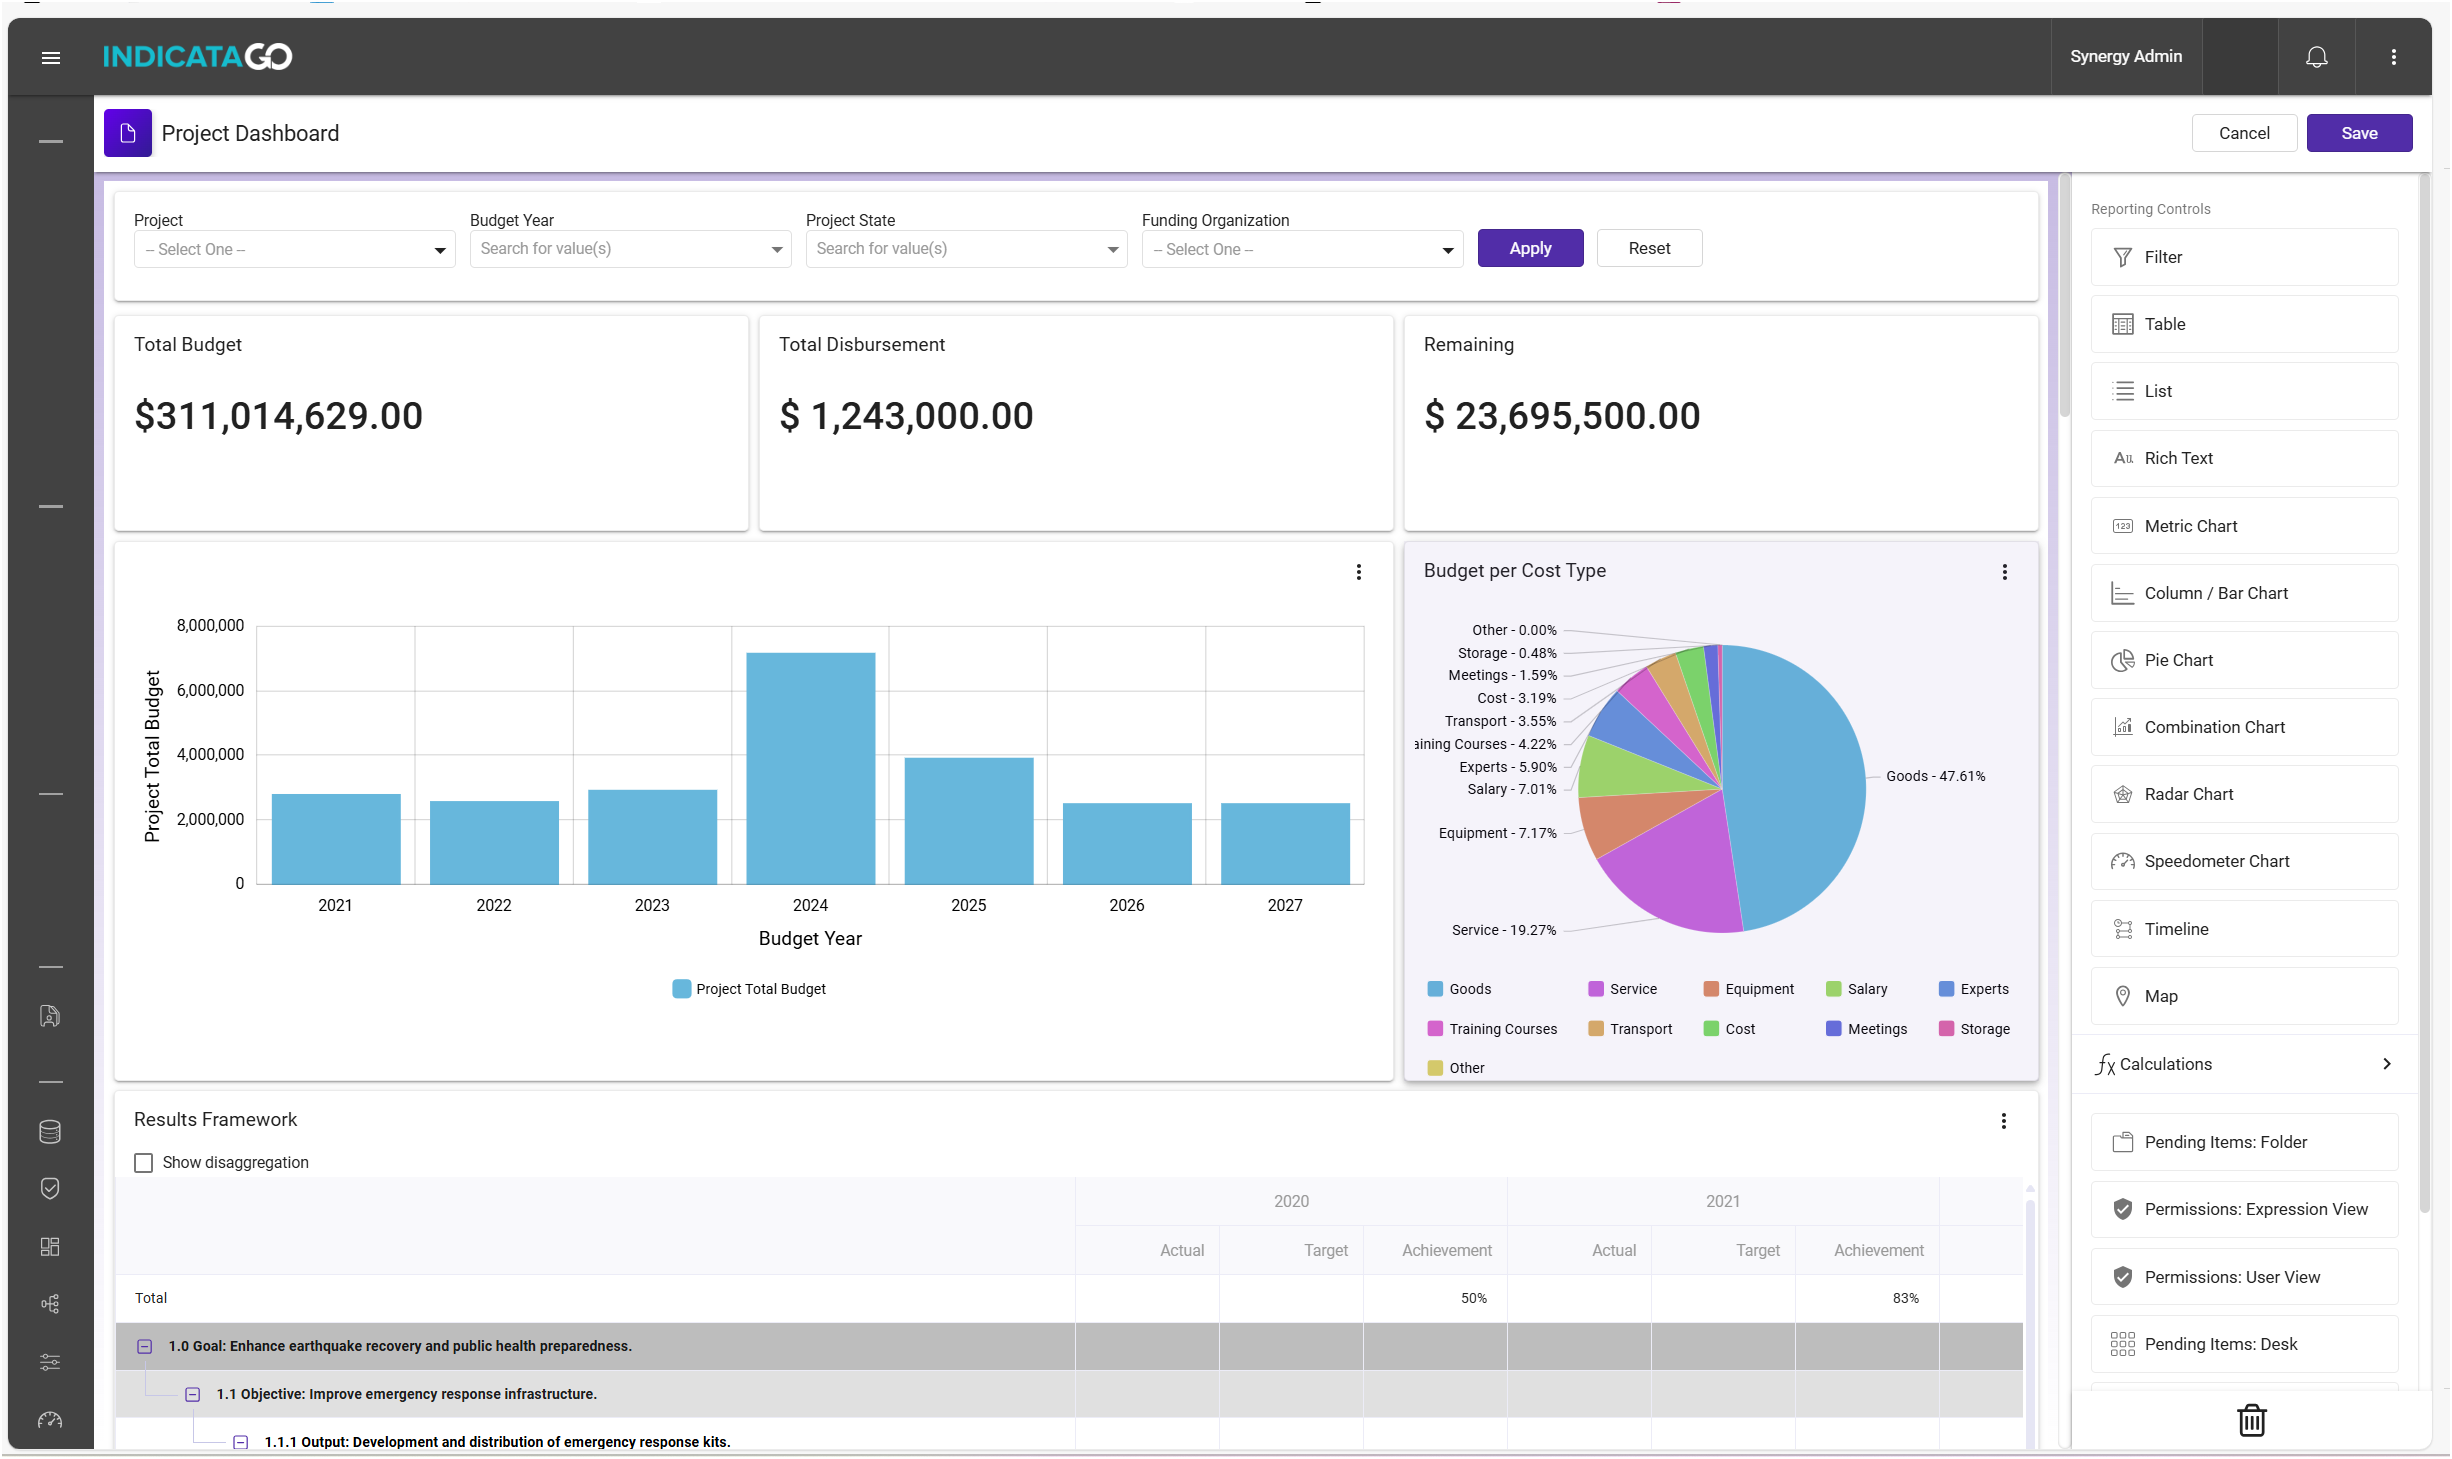
Data Visualization Widgets
Indicata’s Report Builder offers a range of data visualization tools for you to create compelling charts, graphs, and visuals. Moreover, you have the flexibility to drag and drop data visualization widgets, select databases, and prepare reports on the fly. You can also customize the report format with different coloring options, apply conditional formatting, and more to make data interpretation and presentation easy and engaging.
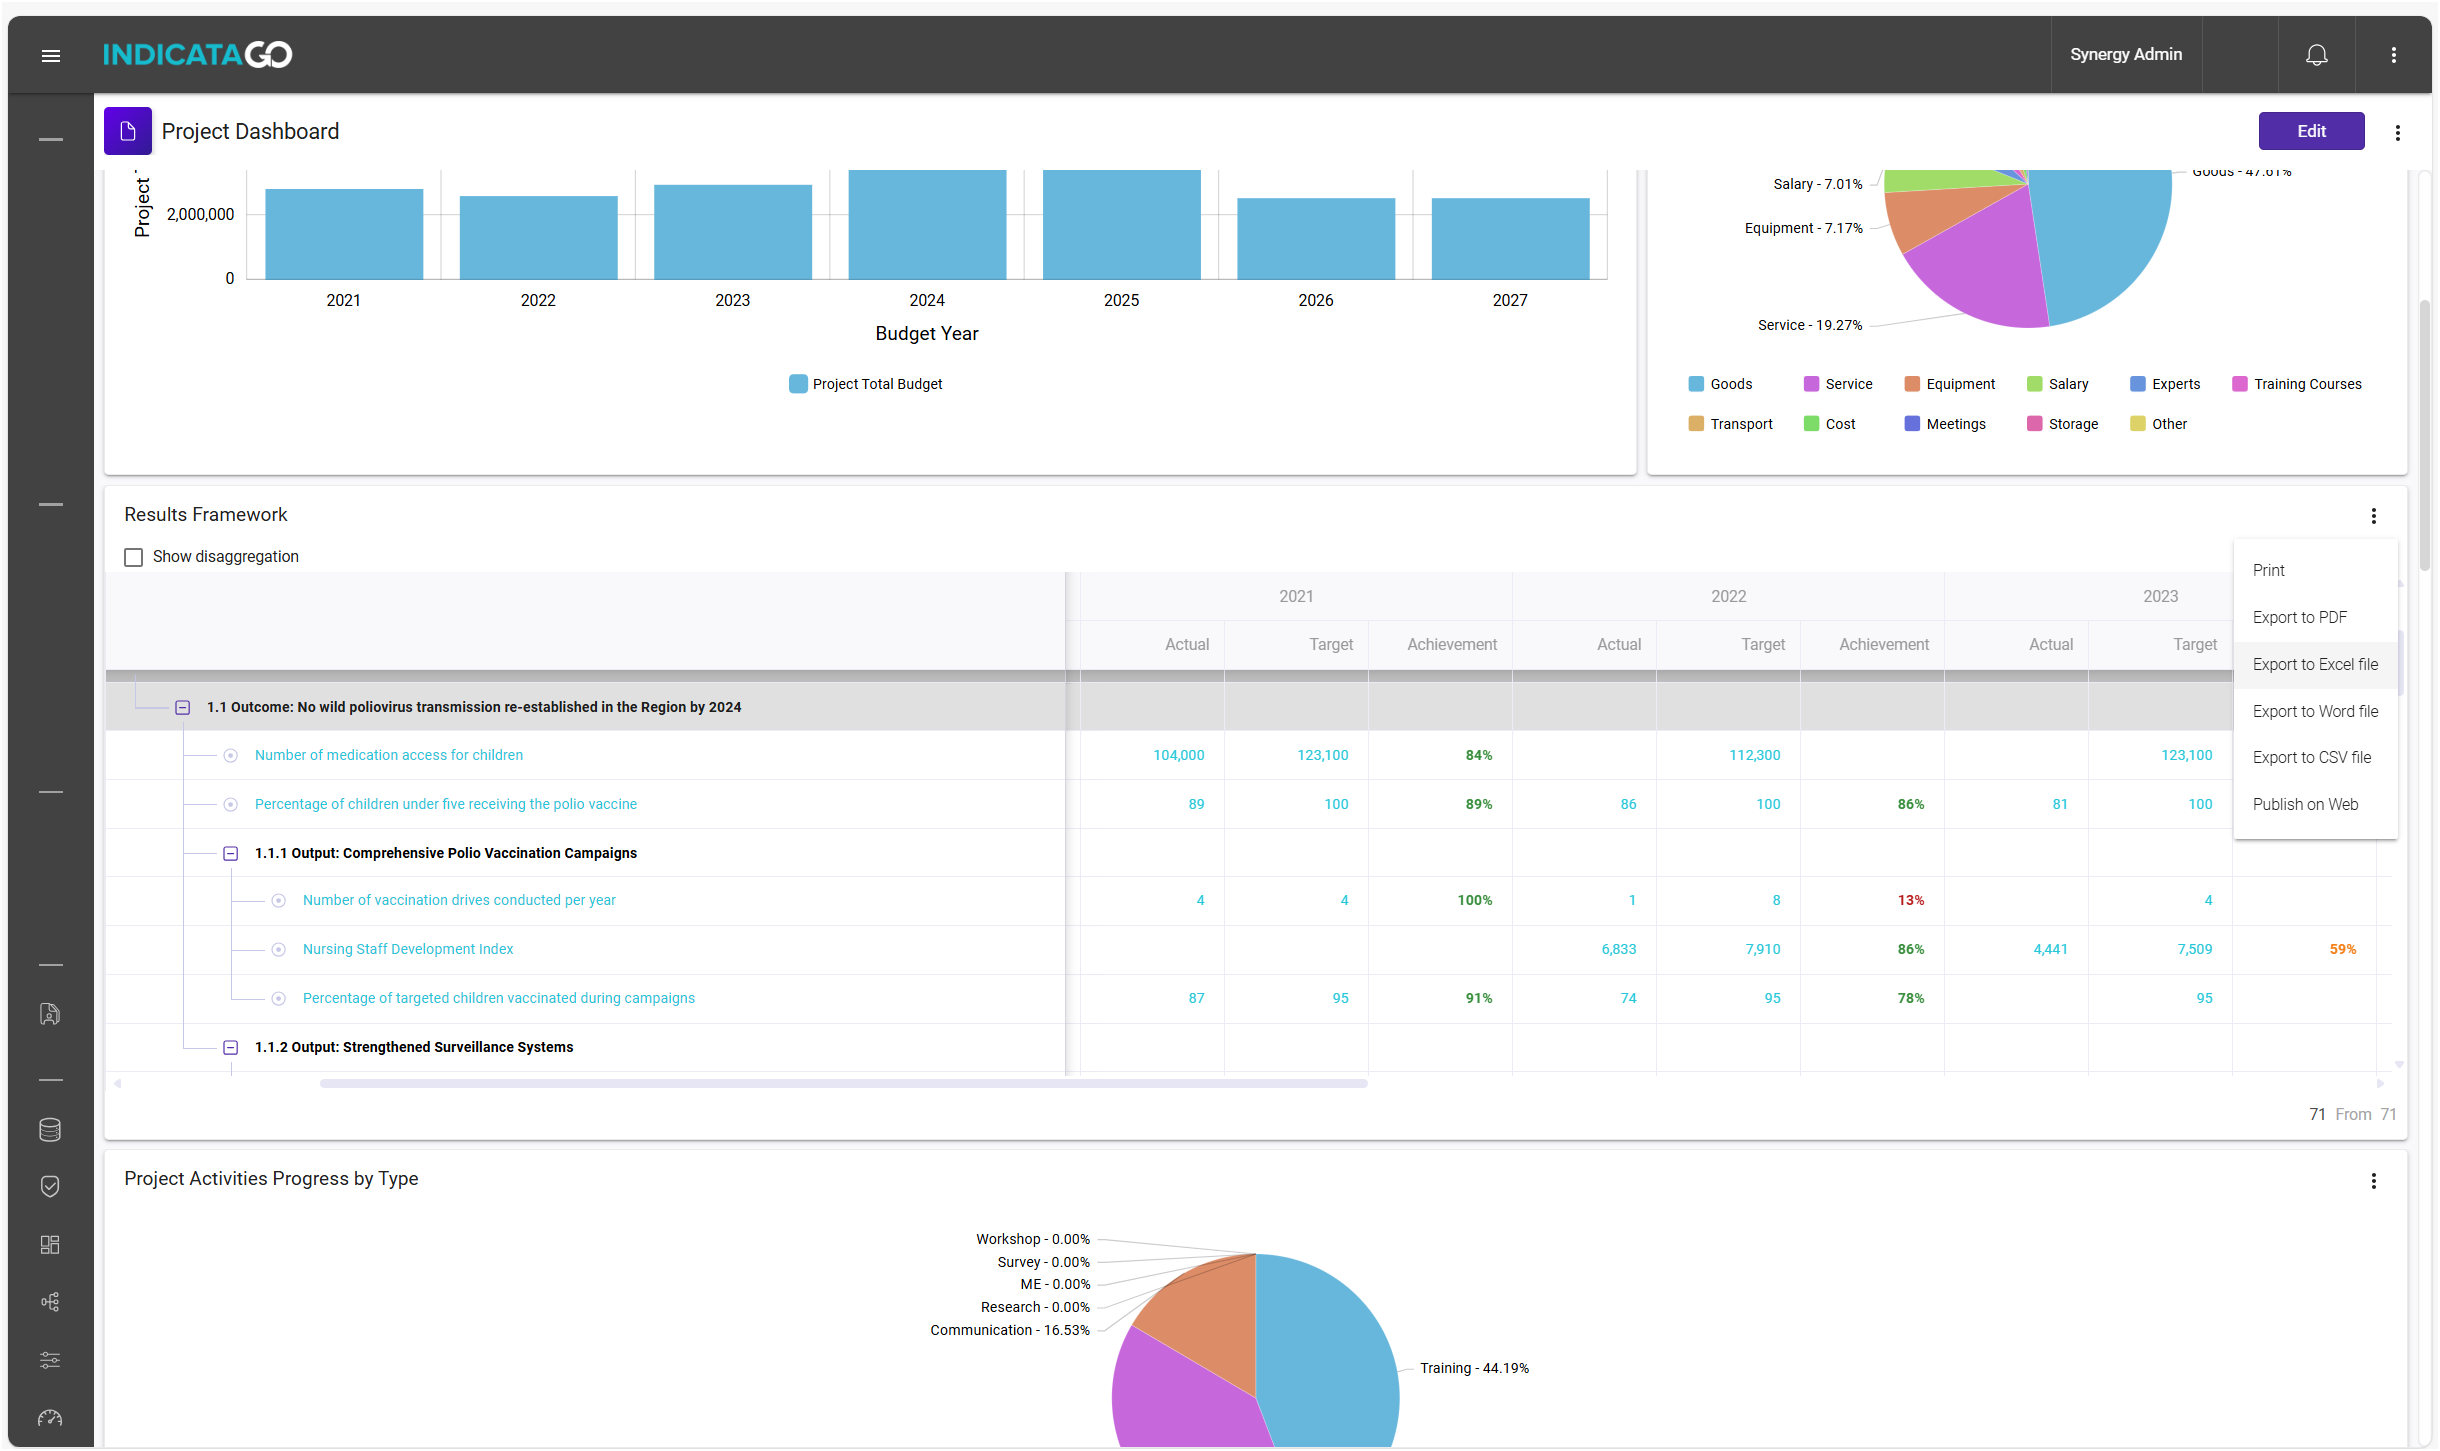
Report Export, Publishing and Printing
Once your reports are ready, you will be able to export them to PDF, Excel, and Word or publish them on external platforms.
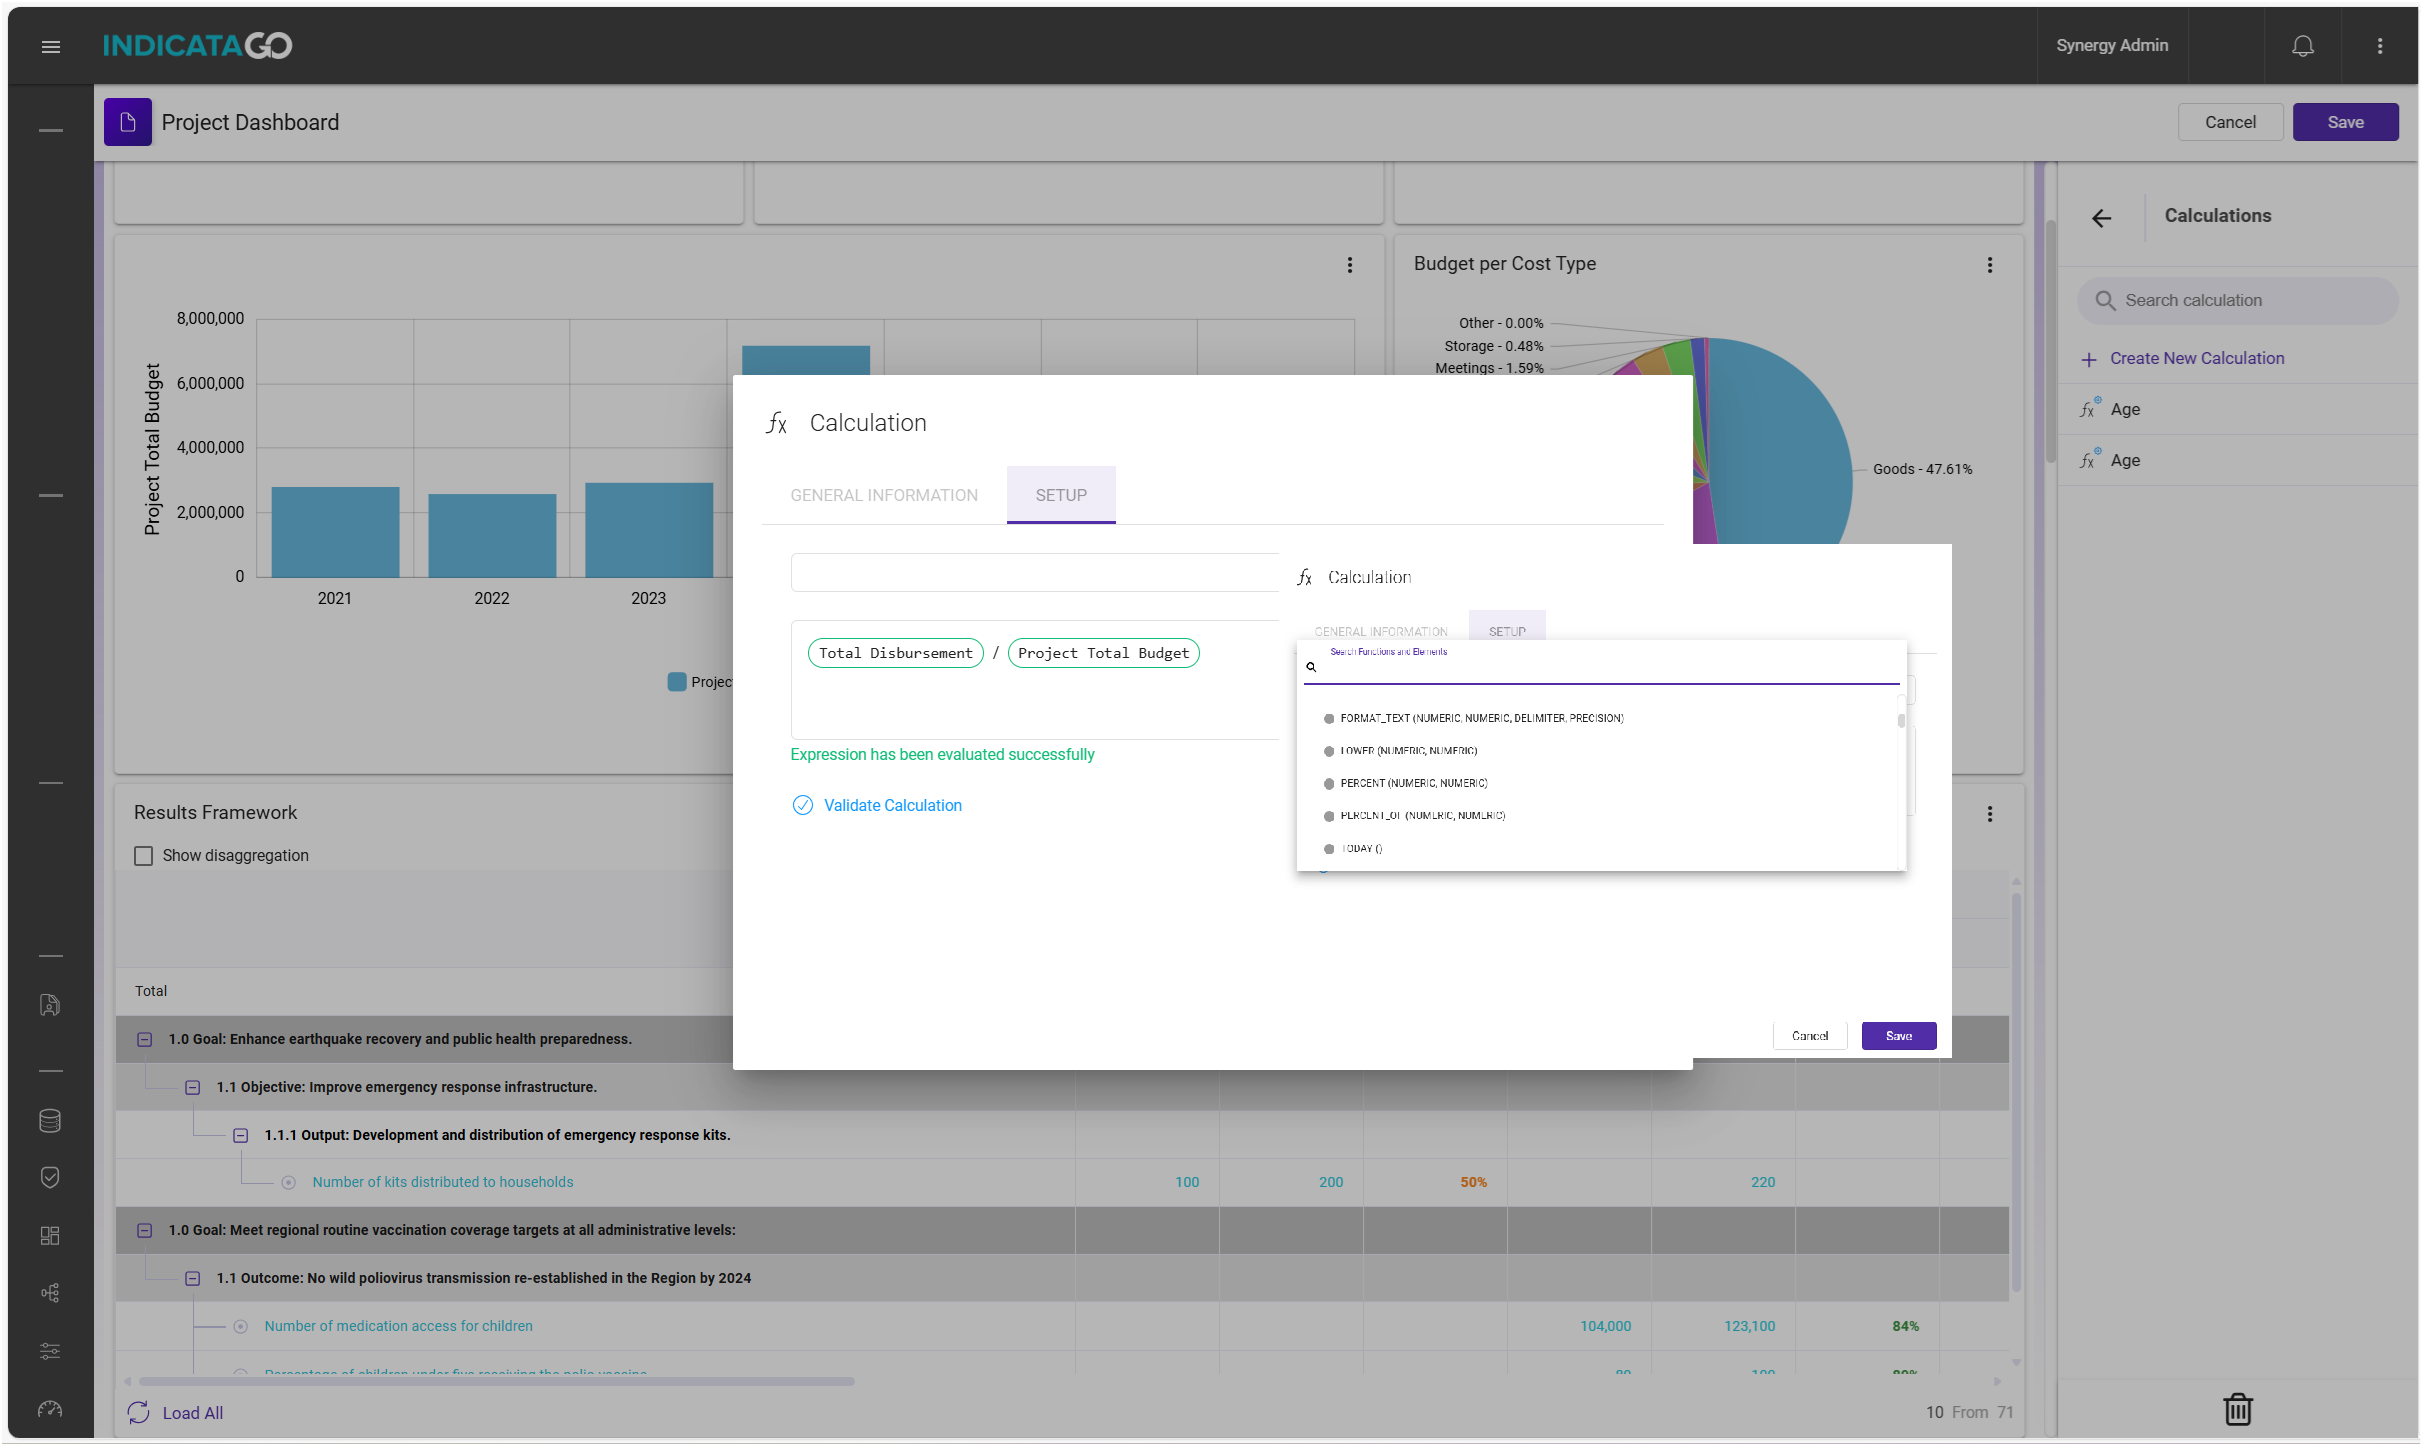
Custom Calculations Builder
User-Defined Calculations empower you to effortlessly combine multiple datasets and metrics, creating custom calculations tailored to your specific needs. Whether you're developing reports or analyzing data, this feature allows seamless integration of various data points, metrics, or key performance indicators (KPIs) to derive insights, providing you with the flexibility to generate precise and personalized analyses.
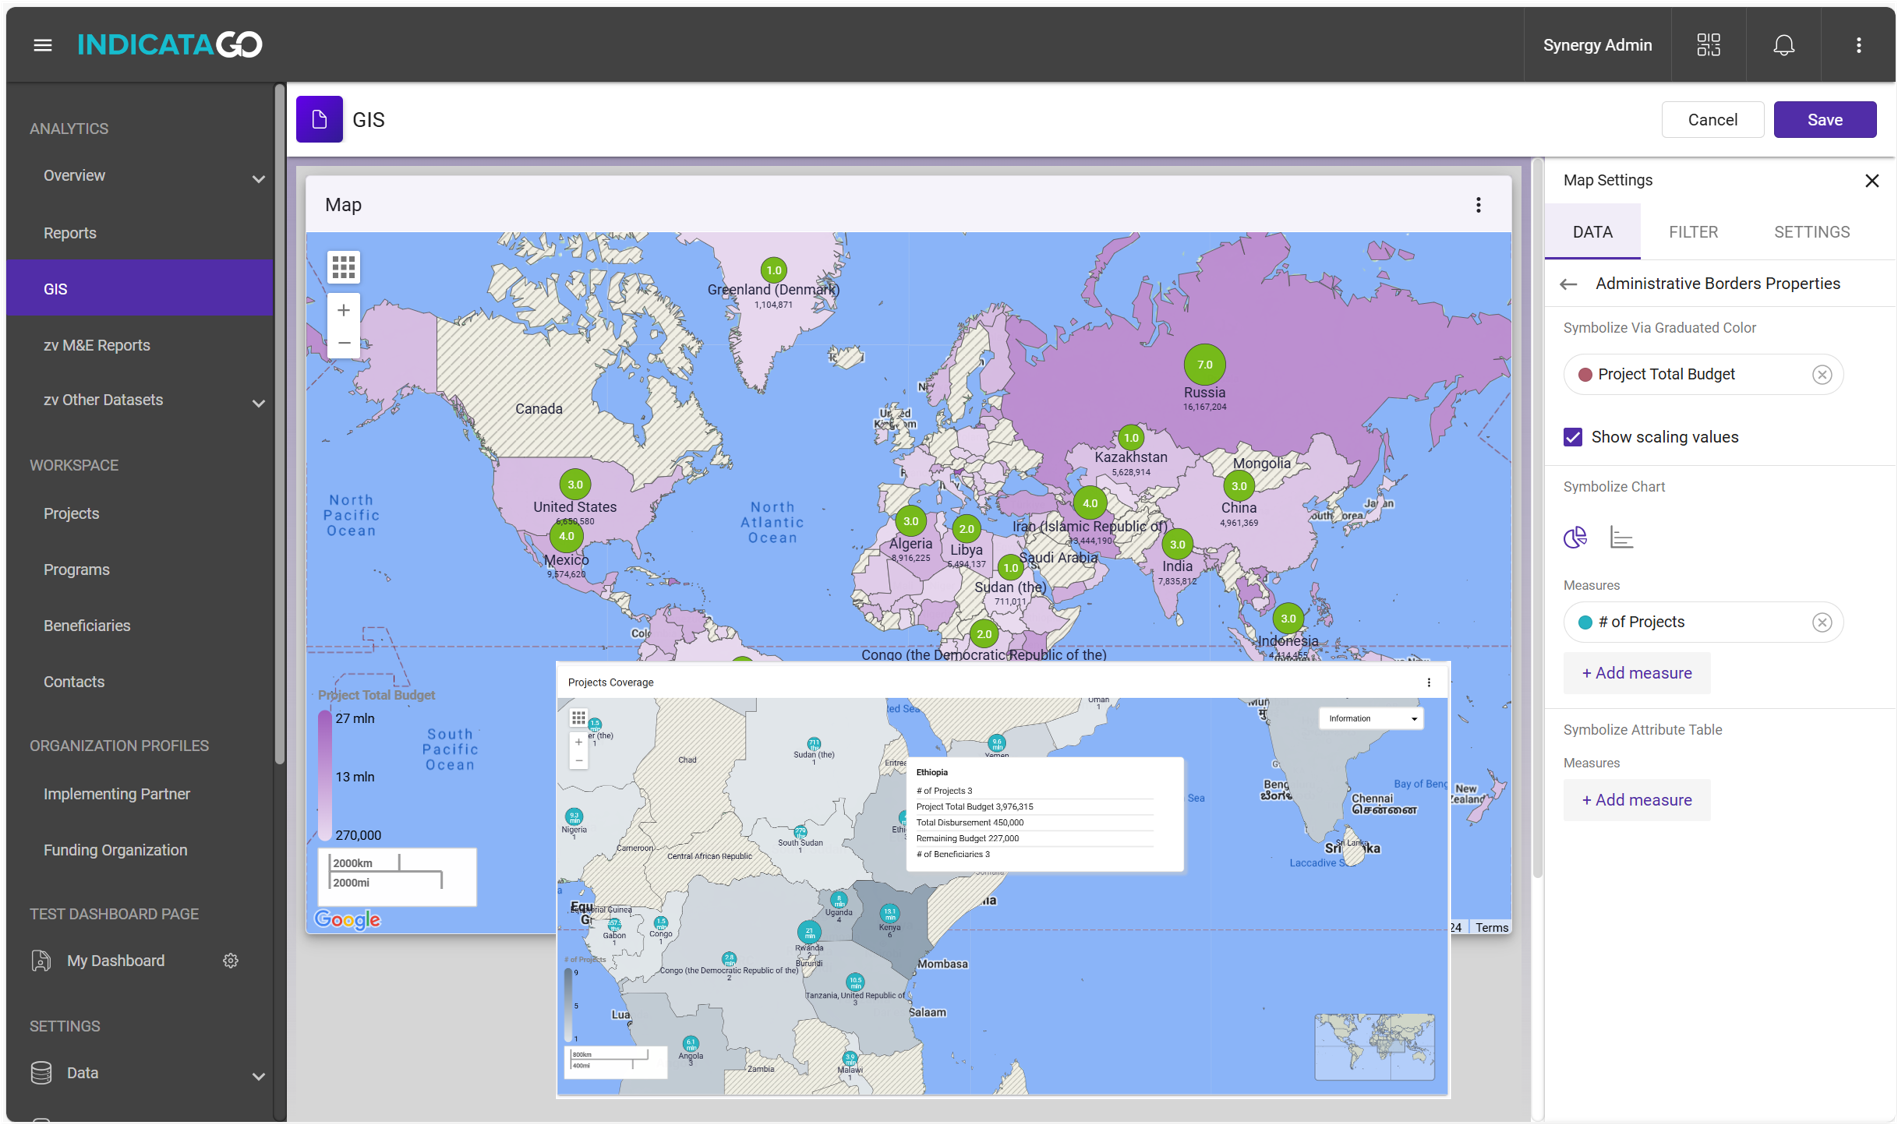
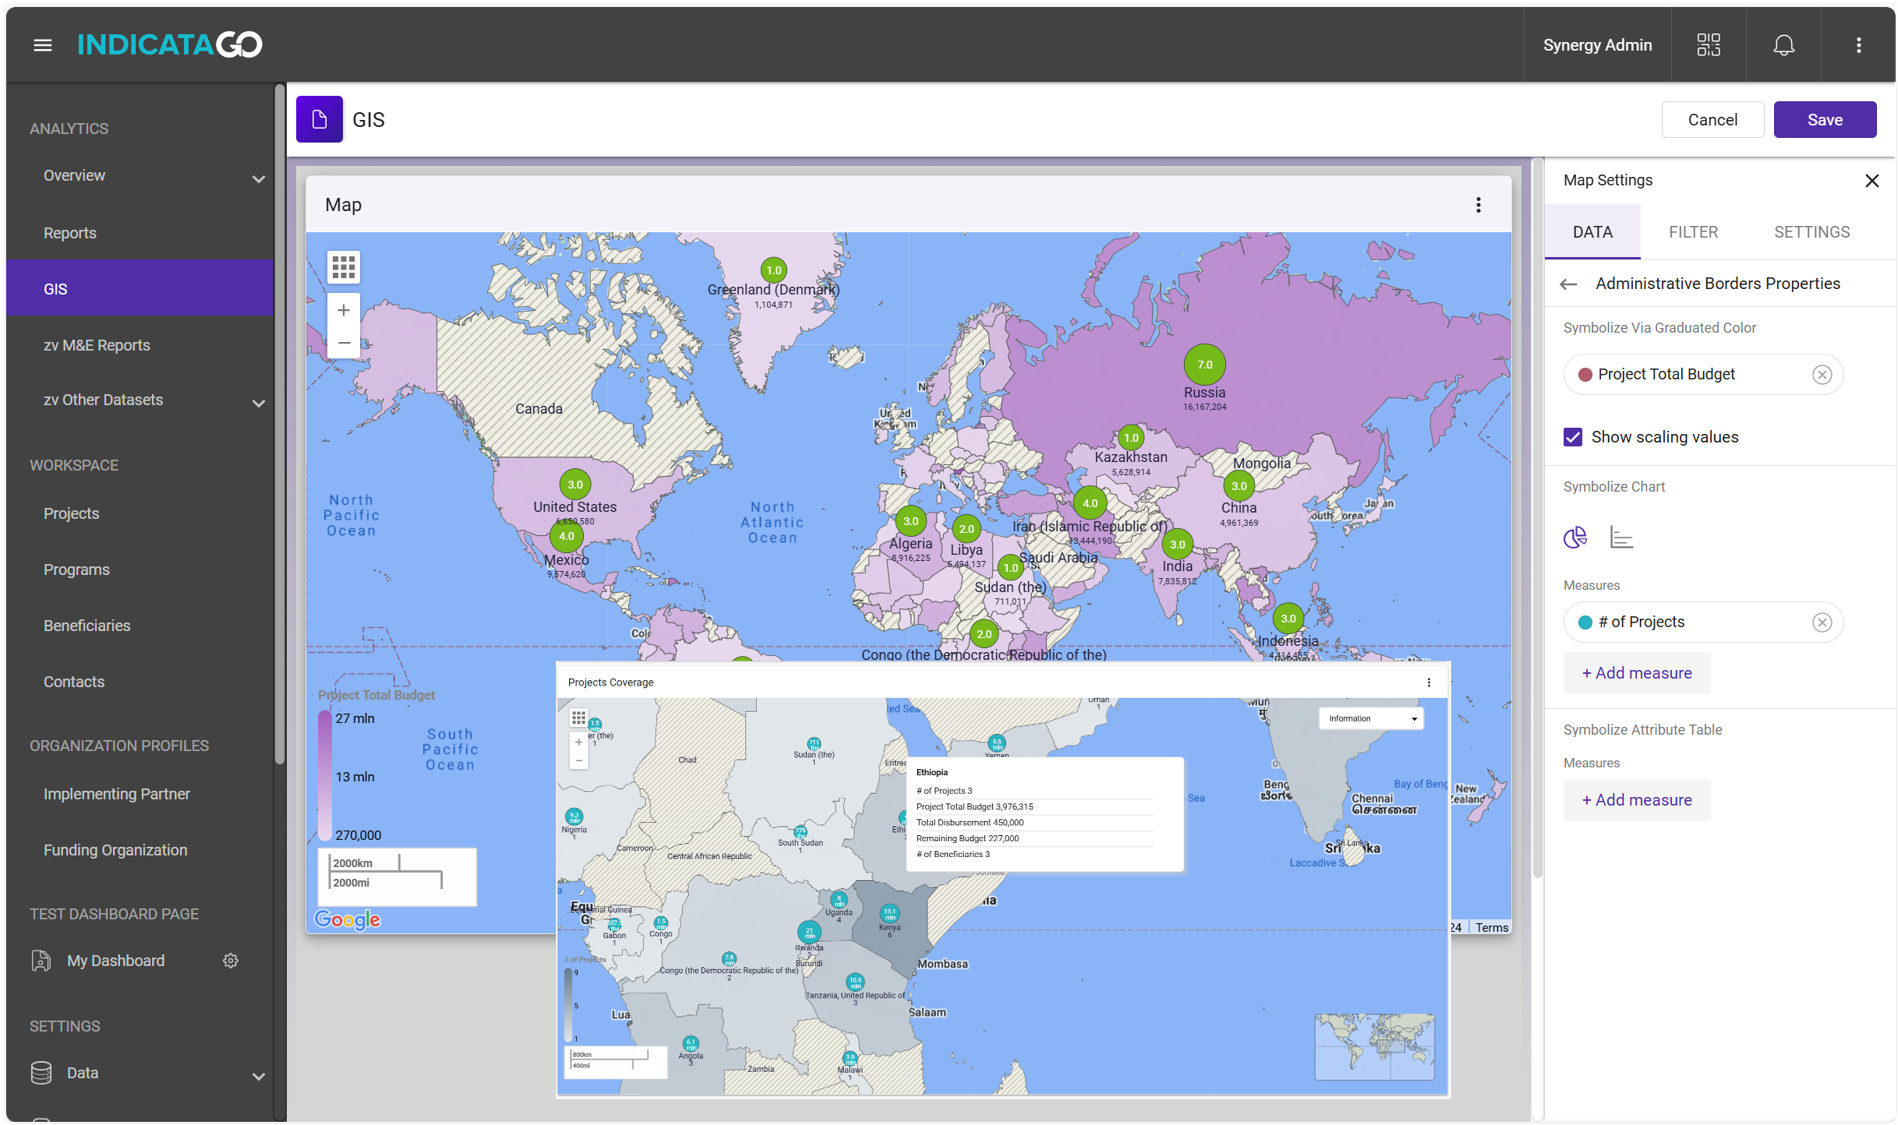
Geographic Data Visualization
We provide feature-rich geographic data visualization capabilities you need to visualize your project performance and impact on maps and charts.

Trusted and Utilized

1150
Tracked Projects

53K
System Users

$ 5B
Managed Budget

18K
Tracked Indicators


“… I would recommend this vendor to any organization – they are extremely professional and deliver high quality outputs".
Dr. Sylvester Kisonzo / ICT Head - AGRA


“It has enabled us to get a holistic, "helicopter and aerial" view of the programme implementation progress. We are able to see which outcomes and their associated activities are dragging and are lethargic, thereby allowing the team to focus and direct more anergy and resources towards them.”
Save the Children International / Malawi team


“The system enables us to provide accountability for our work. We were excited to develop this system with our partners at Synergy…”
USAID Bureau for Food Security /